

How often do you need to understand or explain how your business operates?
And how much is that throw-away analysis costing you?
The problem
Most organisations cannot answer a simple, but important, question: how do we do what we do?
The information exists - but it is scattered. Process maps live in Visio files or on SharePoint, disconnected from the customer journeys that depend on them. Operating model canvases sit in strategy decks, unconnected to the processes that deliver them. Risk registers, system maps and SOPs each tell part of the story - in different formats, owned by different teams, produced at different points in time.
The problem grows as each project produces its own artefacts and moves on. The result is that no single person - and no single tool - holds a complete, connected picture of how the organisation operates. When a project starts, the first question is always the same expensive, repeated, one: “How do we do what we do?”
That is the problem Navigator solves.
The solution
Navigator is our Business and Process Improvement Platform. It is a governed, living platform where your processes, customer journeys, systems and roles connect into a single operational picture - accessible to everyone who needs to understand how your organisation works, not just specialists.

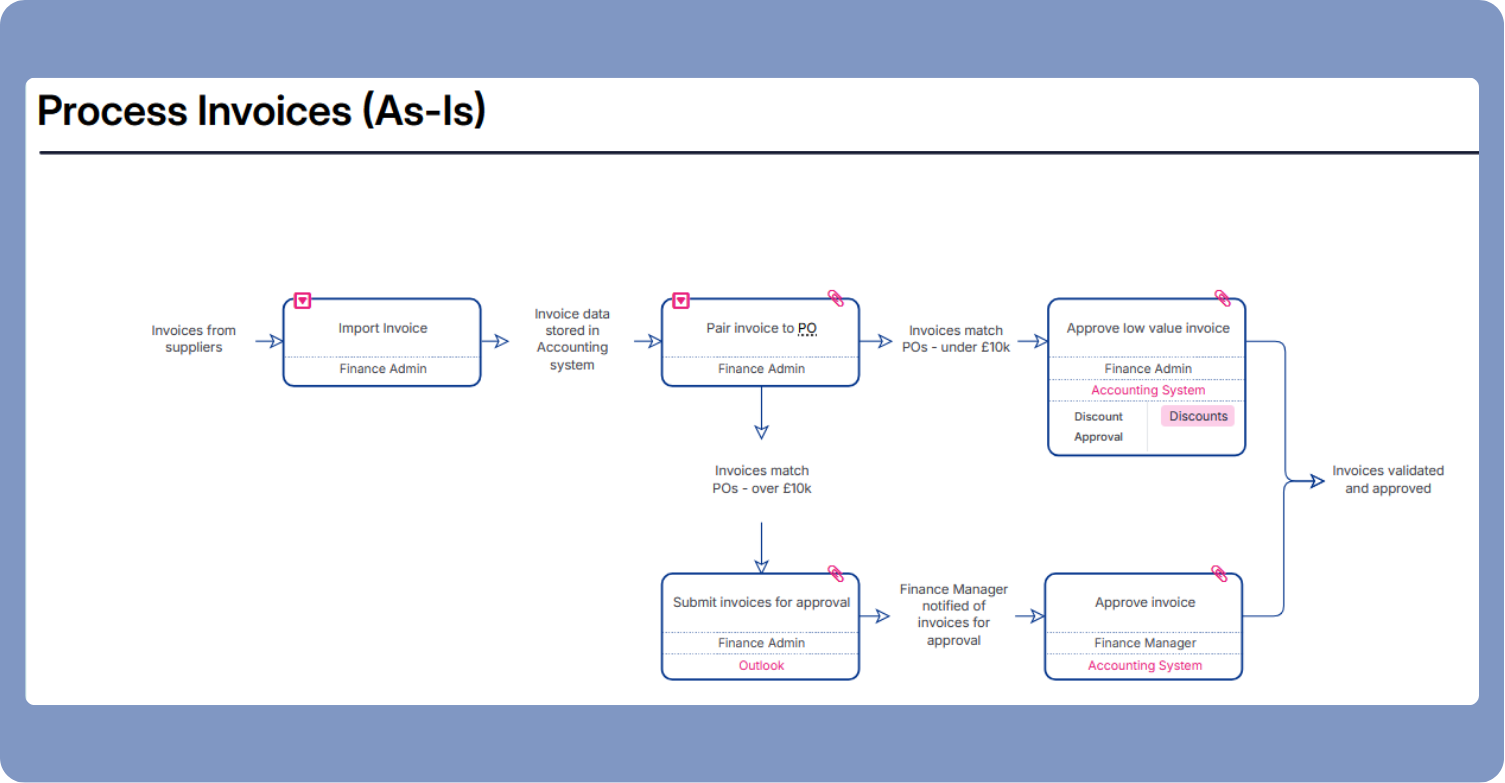
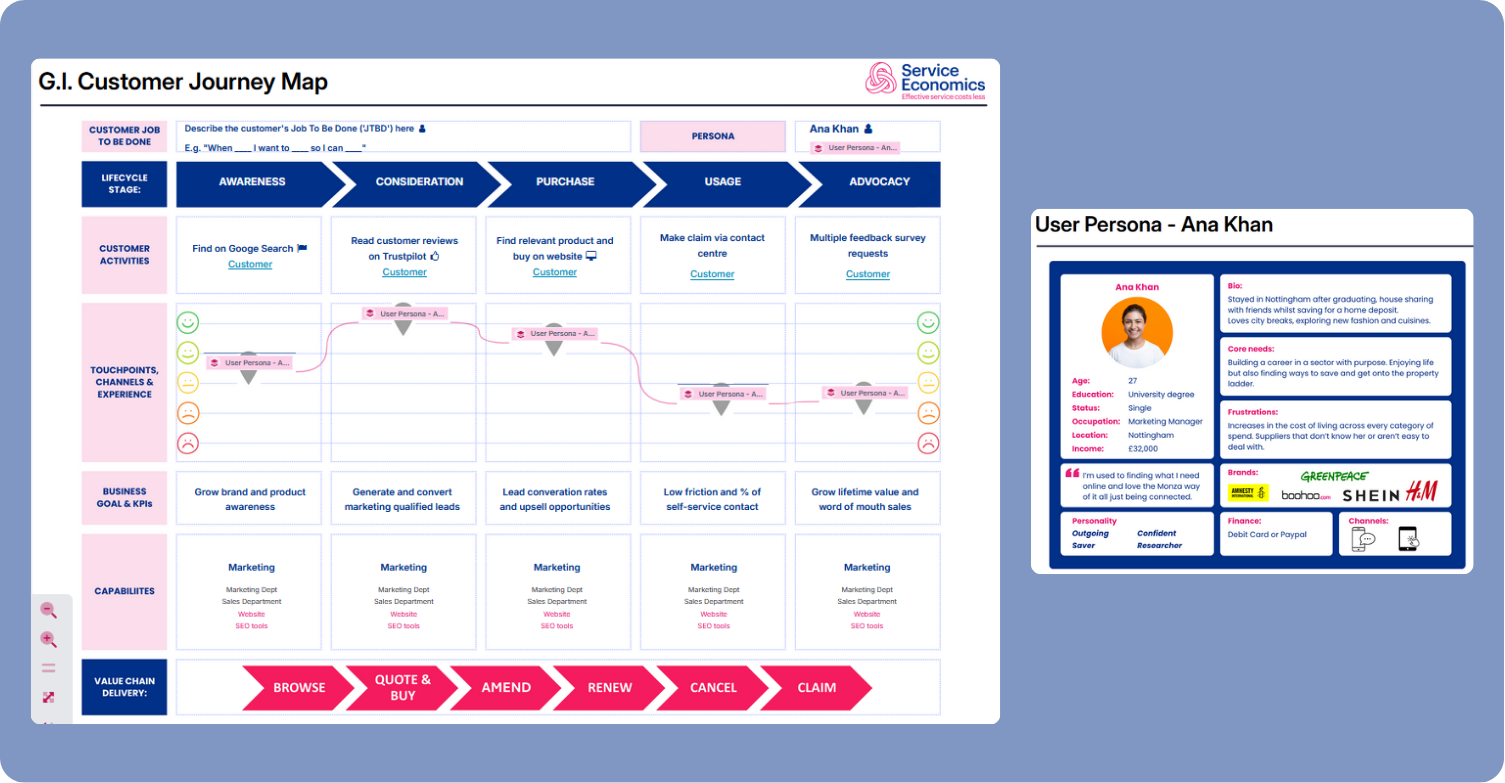
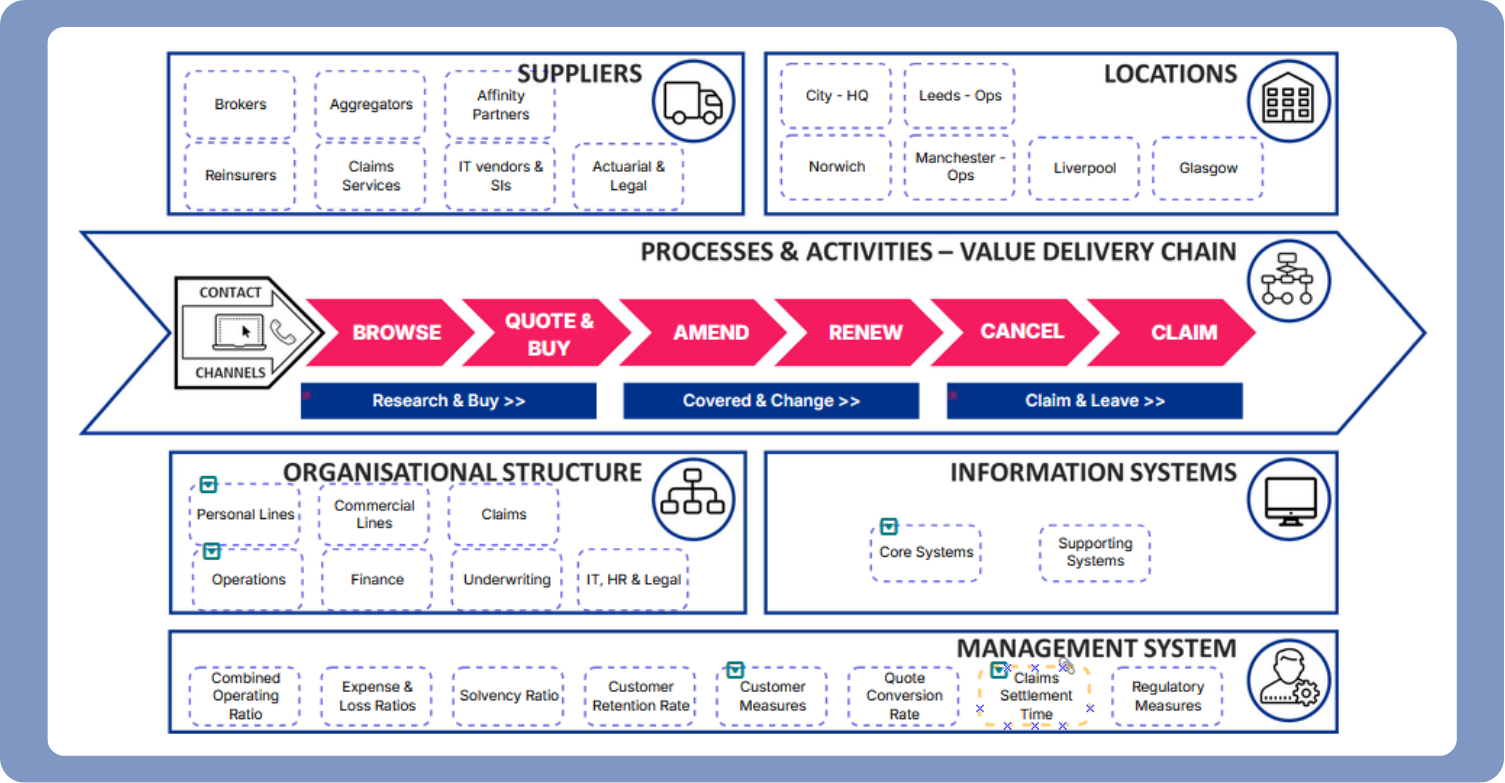
Map
your operational blueprint
Get a connected picture of how your organisation works: processes, customer journeys, roles and systems, in a format everyone can read and use. Attach meta-data such as costs, compliance risks, pain points, etc to get much more value from your processes!

Store
your process library
A governed, searchable asset that is easy to find, easy to update and keep current. Link documents or URLs to processes. Every project, change event and regulatory trigger costs less because the baseline already exists.

Model
your business digital twin
Use your process assets to model change, test decisions in your ‘digital twin’ and understand the impact across processes, systems, roles and dependencies before committing real resources, time and expense.
Each Navigator level delivers standalone value and builds on the one before.
Already have process documentation in Visio or similar tools? A proven migration path means nothing gets thrown away.
Learn more in this video:
Interested to explore the value you could unlock in your business with Navigator?
Why it matters
Navigator turns process knowledge into a strategic asset. Instead of static documents that get filed and forgotten after each project, every piece of work adds to a living library of business intelligence - showing where service waste is costing money and where improvement will have the most impact.
Because processes connect to customer journeys, which connect to the rest of your operating model and to each other, you can see how changes in one area affect the whole service. That’s the difference between improving in isolation and improving as a connected system.
Hows it’s used
These are just a sample of the use cases supported by Navigator:
Regulatory & Audit Readiness - Demonstrate how your operation actually works, with evidence.
Technology Projects - Map current processes and system dependencies before implementation.
Continuous Improvement - Model improvements safely before implementing them.
Sourcing Decisions - See what you’re really outsourcing. Evidence-based procurement.
Whatever your starting point - Navigator supports multiple use cases and safe, structured growth.
Proven results
We’ve helped businesses like yours unlock improved outcomes through better connected and more effective service. Here’s a flavour of what they’ve achieved:
25% business analysis savings
UK housing provider using Navigator to capture new IT system user requirements connected to their processes in a reusable library
80% time saving on process discovery
UK service provider slashes process discovery time using Navigator
"Navigator has helped us better understand and faster document our current processes and operating model.
It's already saved us huge amounts of time by avoiding the usual need for project by project 'rediscovery'.
From AI, digital transformation to regulatory insights it's changing the way we approach business improvement"
Head of Business Improvement, Livv Housing Group
Clients
We help leaders of complex service businesses deliver more effective service at lower cost:

"Service Economics really impressed us with how quickly they got to the heart of the issues, and the collaborative way in which they approached the project." - CIO, Metfriendly.
"Service Economics really impressed us with how quickly they got to the heart of the issues, and the collaborative way in which they approached the project." - CIO, Metfriendly.
Get started

Book a Navigator demonstration.
Start with a focused pilot and see the results for yourself.

Expand at your own pace.
Every project adds to your Process Library - building organisational knowledge and saves huge sums by avoid repeated ‘throwaway’ business analysis and discovery.